
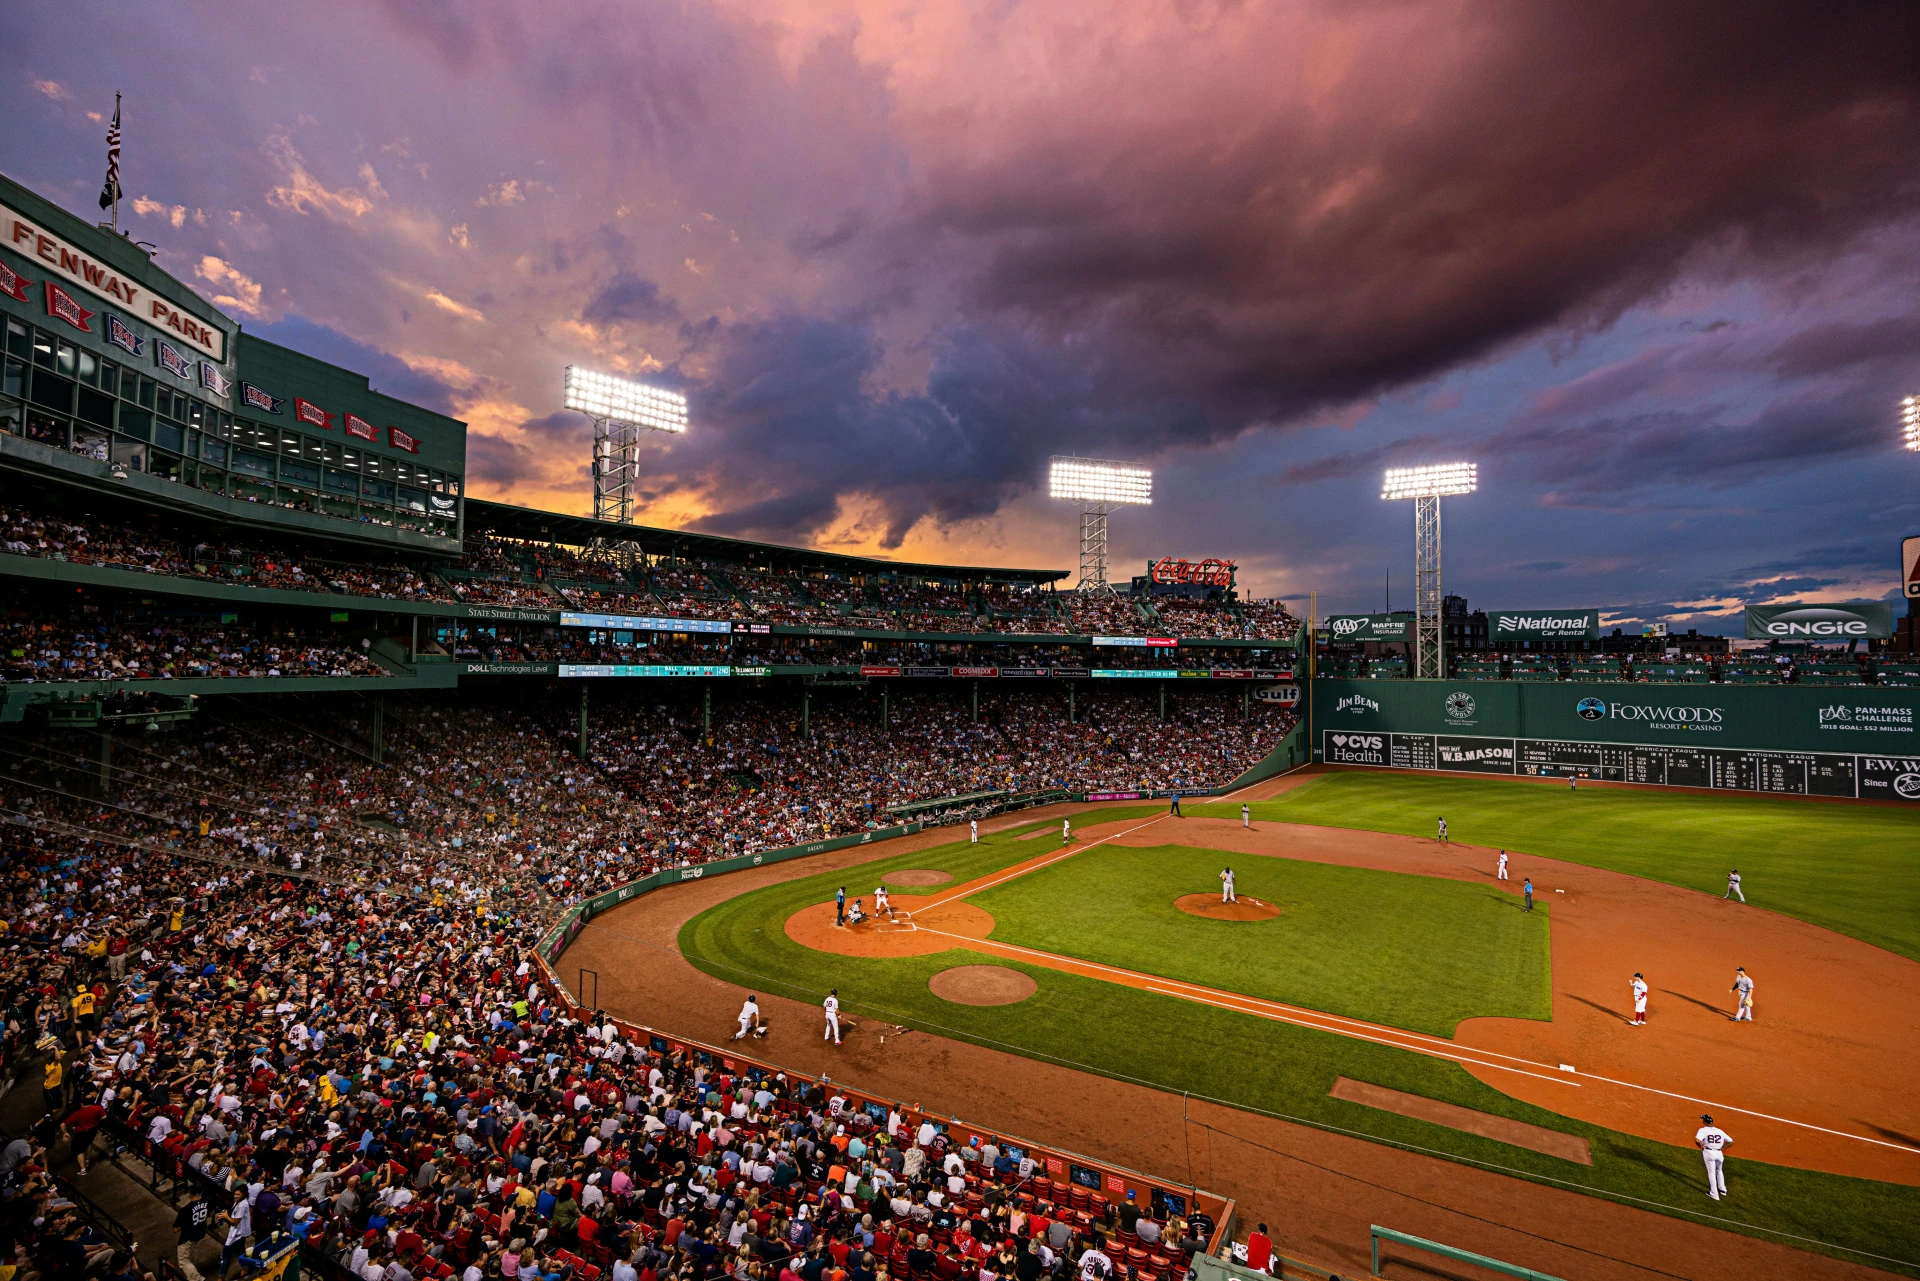
Fenway Park, Boston. Photo: Osman Rana / Unsplash.
In 1911, Boston Red Sox team owner Charles H. Taylor and his son, Red Sox team president John I. Taylor made a pivotal decision that would change the Red Sox franchise forever – The decision to move from baseball owners to landlords. The Taylors decided they’d build a new ballpark for the Red Sox in the Fenway neighbourhood of Boston, at a cost of $350,000. While they expected the stadium ownership to be profitable, they needed extra money for the construction and sold half their stake in the Red Sox for $150,000. In doing so, they gave up control of the team operations, but made sure the Red Sox would pay them $30,000 per year to use the stadium. The stadium was constructed quickly over the fall and winter, allowing the Red Sox to open up the season and go on to win the World Series in their new home. The fans had a brand new stadium and a winning team. The Taylors had a fantastic investment.
Fenway Park remains in use today, the oldest stadium in North American professional sports. In addition to its age, it’s known for a 37 ft. wall in left field known as the “Green Monster”. Baseball fans know this wall as a towering obstacle for batters to clear in order to get a homerun on what would otherwise be a short field, but the original purpose of the left field wall that would eventually become the Green Monster had nothing to do with homeruns, rather it was to prevent giving a free view of the game to the people on Lansdowne Street. The fans could enjoy baseball – at a price of course. If they thought the game was worth watching, Taylor knew as long as they didn’t have a choice, they’d pay to see it.
Over a century later, and while Taylor’s understanding of the fans still holds true, much in the sport has changed. Players now make more money in a single season than Fenway Park cost to build even accounting for inflation, while stadium costs have climbed into the billions, and “The Green Monster” is how much taxpayers will be on the hook for. In 1953 the Boston Braves moved to Milwaukee to take advantage of a new publicly funded stadium that was built to attract a Major League franchise. Over the following decades, many teams relocated either partially or primarily due to the desire to get a new stadium. By 1972, the Orioles, Athletics, Giants, Dodgers, Twins, Brewers, and Rangers all had left their former homes, and only 6 teams remained in stadiums built before the 1950s. Out of the remaining 16 long-term and new expansion teams, 12 had new stadiums funded primarily or entirely through public measures. 4 were funded by local businesses under the hope that the stadiums would generate additional revenue. 0 were funded by the baseball club.
The Stadium Subsidy Game
Today stadiums are funded by a variety of mechanisms, and public funding is now considered more controversial and more heavily debated than it once was. In the major four sports in North America (NFL, MLB, NBA, NHL), 23 stadiums and arenas have opened in 2010 or later, with 9 of them completely privately financed. The remainder had a public share ranging from 12.5% for Mercedes-Benz Stadium in Atlanta to 81.25% for the Amway Center in Orlando. The most public money to ever go to a stadium is to keep the Buffalo Bills in Western New York, with the state and county combining for an $850 million contribution.
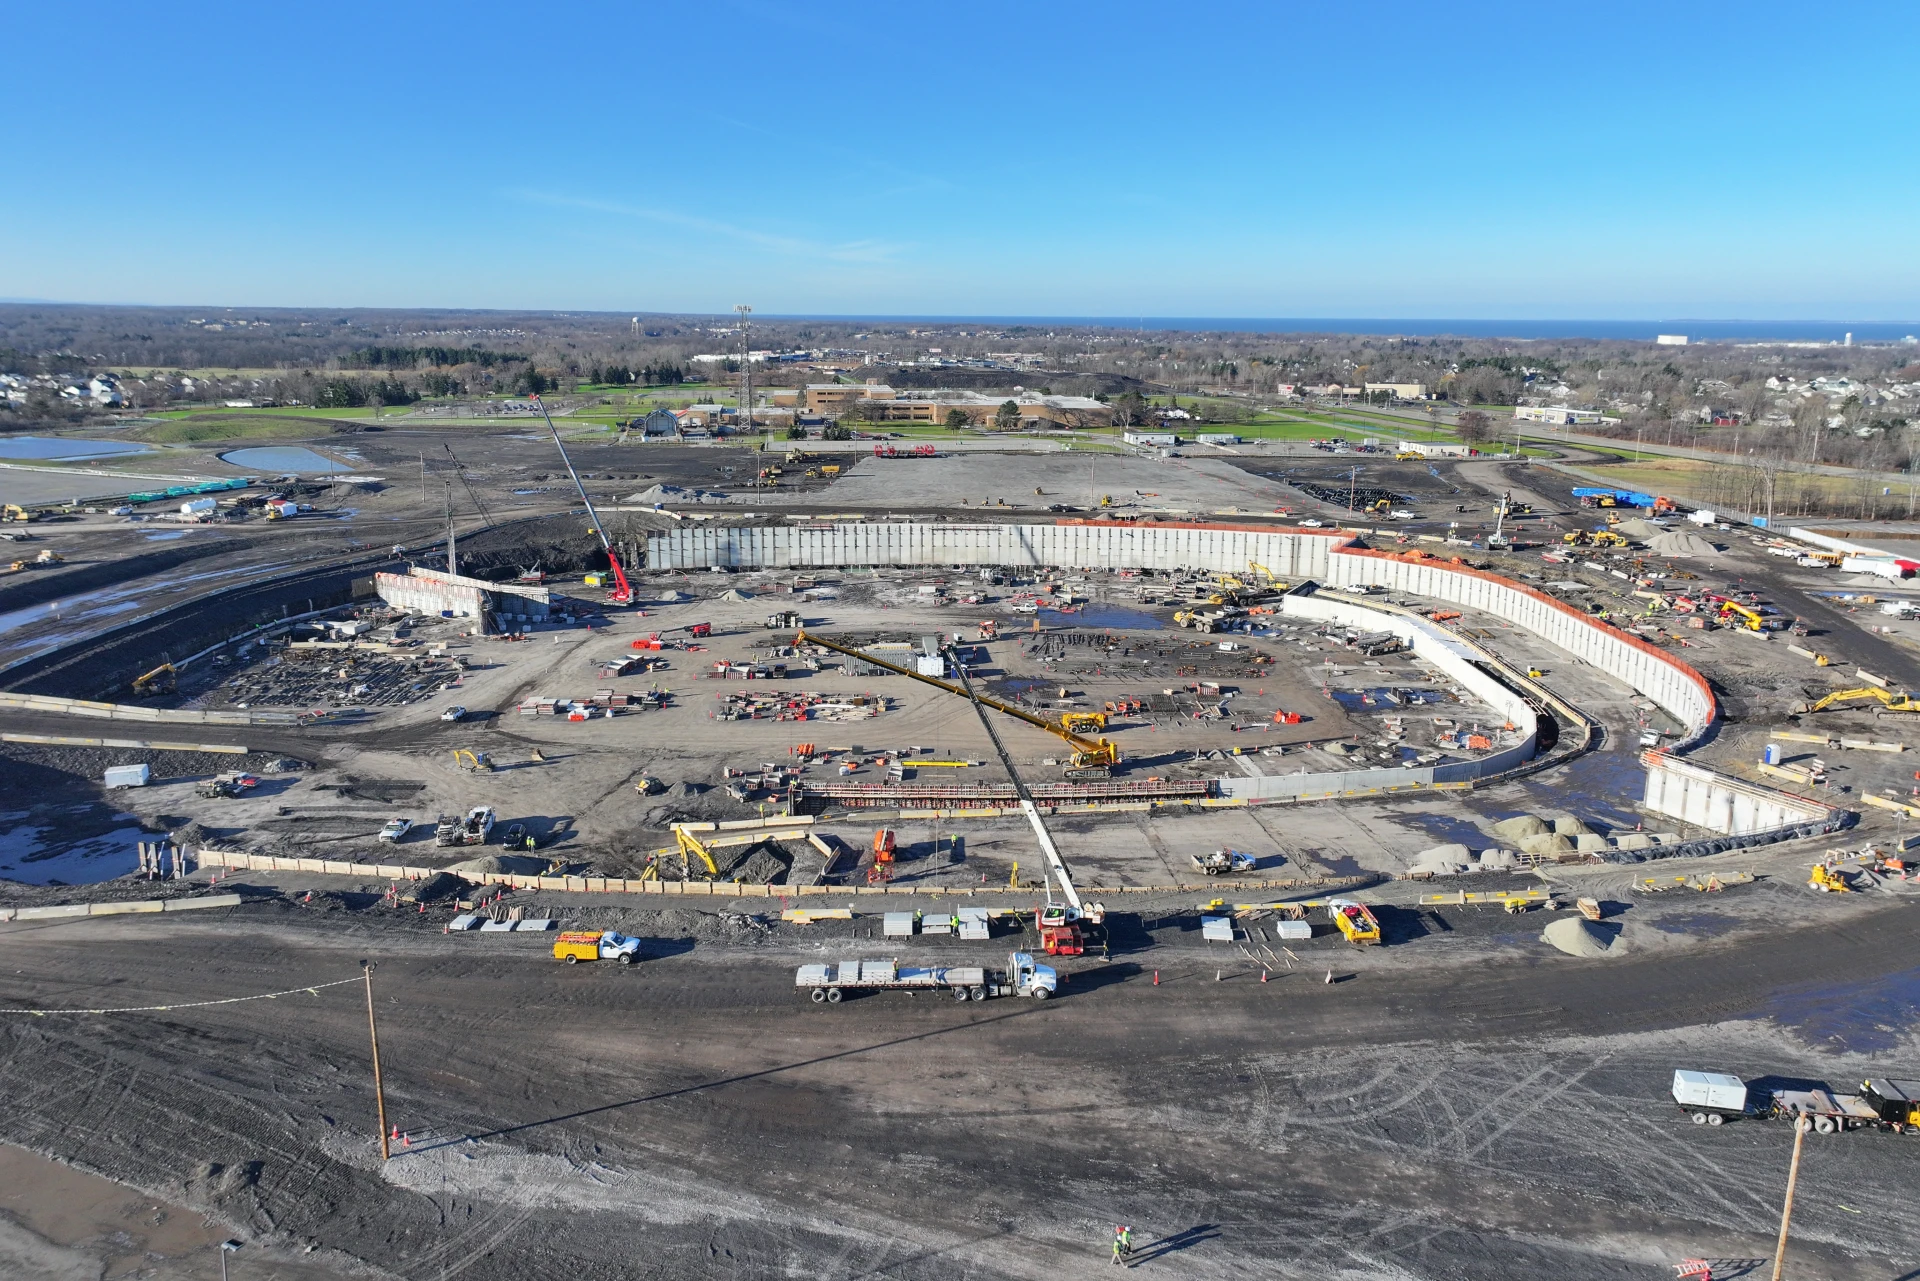
New Highmark Stadium under construction, December 2023. Photo: Quintin Soloviev / Wikimedia Commons.jpg) (CC BY-SA 4.0). Cropped from original.
It seems that more often than not having a viable alternative market seems to be the dominant factor when determining whether or not a team receives subsidy. The NHL led major sports with 5 arenas being privately financed. This may be due to the fact that the NHL attracts substantially smaller interest than the NFL, MLB, and NBA as a league. If the cities are much more indifferent as to whether they have a team, it will be harder to generate support for funding. The NHL in particular has an additional problem of hockey being considered a much more regional sport in terms of interest, reducing the number of potential markets to relocate to. The remaining teams to build completely privately funded stadiums/arenas were all located in New York, Los Angeles, or San Francisco – Larger markets where abandoning them would likely be seen by the public as more of an empty threat.
The NFL showed what the threat of an available large market can do for teams. After 1994, both the Rams and Raiders left Los Angeles leaving the second largest market in the country without an NFL team. In the 22 years before the Rams returned along with the Chargers, nearly half the league secured public stadium funding by either implicitly or explicitly threatening a move to Los Angeles.
When the stadium construction boom occurred in the 1960’s and 1970’s, there was still a belief amongst cities that the stadiums would lead to additional prosperity, GDP, and tax revenue. Even in the cases where the city did not fund the stadium itself, the local businesses stepped in to do so. We now know this is not likely the case. Over a hundred academic studies and countless media articles have been written on this topic, with an overwhelming consensus. There is little to no impact to local spending in the metropolitan area. While there is an uplift in hospitality-focused businesses in the area around the venue, it is net zero in the overall region. There are limited tourism benefits (with the NFL seeing a bit more). Studies vary on the exact amounts, but they’re all pretty consistent in their view that the impacts are not worth the investment. But there’s a monumental catch to this – very few studies take the time to estimate the public utility associated with having a local team. The focus has traditionally taken a financial lens, not a total social welfare lens.
What Is a Home Team Worth?
Social welfare simply refers to the collective well-being society receives from having access to a good or service, and typically is the key measure used when doing cost-benefit analysis on public funds. The goal of investment for a government is to ensure that what they’re spending money on is worth the money to the public, not necessarily to make a profit. When we build parks, no one is expecting them to increase tax revenue. Public transit projects virtually never recover their costs, but are built in order to improve the lives of the residents of the region. Similar to other public investments, the question should not be “Is this stadium a good return on investment for the city budget?” but rather “Does the public utility of the investment exceed the cost?”
This is where the research gets interesting. There has not been a lot of research that has accounted for this, despite it being far and away the greatest benefit of having a team in the city. If Boston lost the Red Sox, the city budget will not suffer but ask any Bostonian and it will be obvious the city absolutely will. A 2001 study by Johnson, Groothuis, and Whitehead “The Value of Public Goods Generated by a Major League Sports Team” tried to answer this exact question after the Pittsburgh Penguins declared bankruptcy and were at risk of moving. In a survey, Pittsburgh residents were asked about how much money they would be comfortable with the city paying in order to buy the team and keep it in Pittsburgh. The mean value per household was estimated to be $5.57 in 2001 dollars, with $4.08 (73%) of that being what’s called “Nonuse value” – Value associated with having the team in the city not related to directly attending games.
In 2008 Fenn and Crooker took another attempt to monetize the value of a sports team to a region. They noted the 2001 study may be an undercount, as the survey was done shortly after the Penguins found stable ownership and committed to remain in the city, reducing the legitimacy of the threat of them leaving. At this time, the Minnesota Vikings were at risk of leaving Minneapolis due to a quickly deteriorating stadium, and the authors used this as an opportunity to again attempt to assess the value of the team to the community. Their work came to the conclusion that the Vikings were worth a total non-annual figure of $571.60 per household (2005$).
A 2010 study by Castellanos, Garcia, and Sanchez estimated the value of the Spanish La Liga team Deportivo de A Coruña to the metropolitan area based on a 2003 survey with a conclusion that the annual willingness to pay per adult in the city was €11.71 (2003€), of which 81.8% is nonuse value.
Simultaneously in 2010, Ishizaka and Mano estimated the value of a baseball team in Japan at ¥4,086 (2010¥) per adult per year, though it eliminated anyone from the survey who refused to pay any money to keep the team on principle even though they valued the team. If instead those respondents were to be counted as zero willingness-to-pay data points as their responses indicate, the value drops to ¥3,606 (2010¥).
These are the main papers done to try to quantify this important value. It’s a bit tough to compare them in different years, different currencies, and different sports, so let’s try to normalize to get an estimated 2026 USD value for an NFL team and scale from there. For those interested in the methodology used to bring them into a comparable dollar figure, I’ve recorded that at the bottom of the article.
| Study | Original Value | $2026 NFL-Equivalent Value (Annual per adult) |
|---|---|---|
| Johnson, Groothuis and Whitehead (2001) | $5.57/year/household (2000$) | $14.65-$17.58 |
| Fenn and Crooker (2008) | $571.60 /household (2005$) | $27.83 |
| Castellanos, Garcia and Sanchez (2010) | €11.71 / year / adult (2003€) | $21.59 |
| Ishizaka and Mano (2010) | ¥3,606-¥4,086 / year / adult (2008¥) | $26.90-$30.47 |
Comparison of willingness-to-pay estimates, normalized to 2026 USD. Source: article calculations.
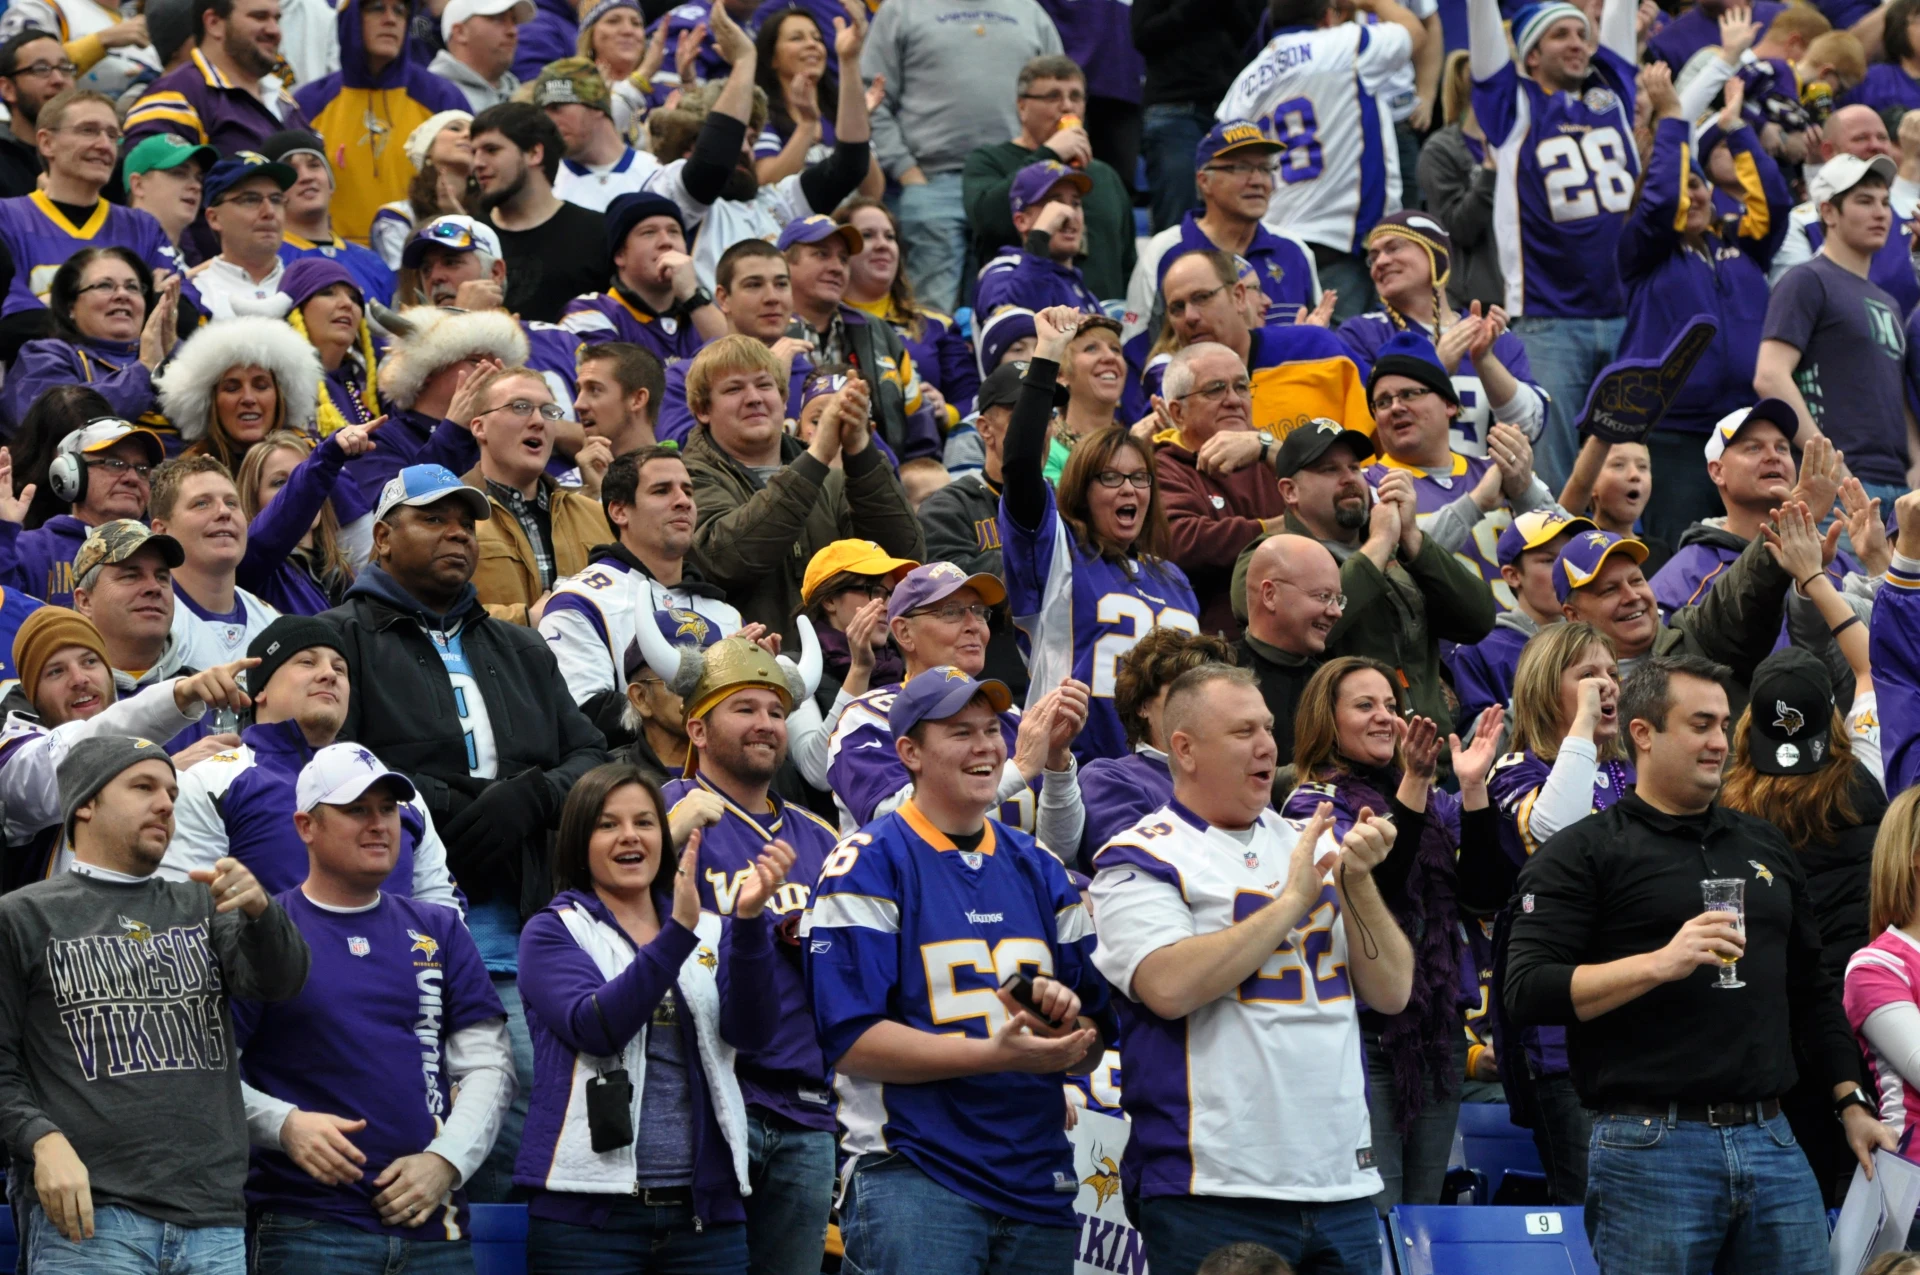
Minnesota Vikings supporters. Photo: Joe Bielawa / Wikimedia Commons (CC BY 2.0).

Interestingly despite being very different studies, their normalized conclusions are relatively consistent. The 2001 study is on the low end, possibly due to the concerns raised by Fenn and Crooker, and the Ishizaka and Mano study sets the high end, possibly due to a methodology that excludes those who would refuse to pay public money for a team. We’ll carry the full ranges forward though and generate a midpoint using them, coming up with a table for every league based upon the percentage of adults that consider themselves to follow and/or regularly watch a team.
| League | Range per Adult per Year | Midpoint |
|---|---|---|
| NFL | $14.65-$30.47 | $22.56 |
| MLB | $9.95-$20.70 | $15.32 |
| NBA | $9.95-$20.70 | $15.32 |
| NHL | $5.53-$11.50 | $8.52 |
Estimated annual value per adult by professional sports league. Source: article calculations.
This lens looks at the value of a team to their community. When you look at recent stadium decisions from this lens, the picture changes. If a team has a credible threat to relocate, the vast majority of stadiums start potentially justifying their public investment for the good of the local population. Looking back at all current stadiums and arenas, only 4 have had public subsidies that exceed the team value to the community.
In 1983, the Calgary Flames got a new arena after moving from Atlanta. While on the surface the $97.7 million (CAD, 1983$) fully publicly-funded arena could not be justified (the population would have needed to be roughly double what it was at the time), it was needed not just for the Flames but the upcoming 1988 Calgary Olympics.
In 1996, Nashville constructed Bridgestone Arena to house their new expansion Predators with 100% public funding at a cost of $144 million (1996$). Assuming a typical level of NHL interest amongst the city, the region would have needed ~1.65 million residents to justify the arena investment. When the Predators started play, the region held only 1.15 million residents.
In 2016, Edmonton put $310 million (CAD, 2016$) towards the new home of the Oilers, Rogers Place. The region had 1.32 million people in 2016, but would have required 1.79 million to justify the investment. It’s possible however that given the substantially higher level of interest in hockey for Canada compared to the United States, that this investment also was potentially worthwhile for the community.
Finally this year the new Highmark Stadium opened for the Buffalo Bills with a taxpayer contribution of $850 million. On the surface to justify this, the regional market would need to be almost twice the size of the 1.1 million people that reside there. While the Bills may have a larger audience across the border who are happy to have them in Buffalo, it would be unreasonable to consider their collective social welfare when it comes to a subsidy provided by American governments.
Knowing When to Play Ball
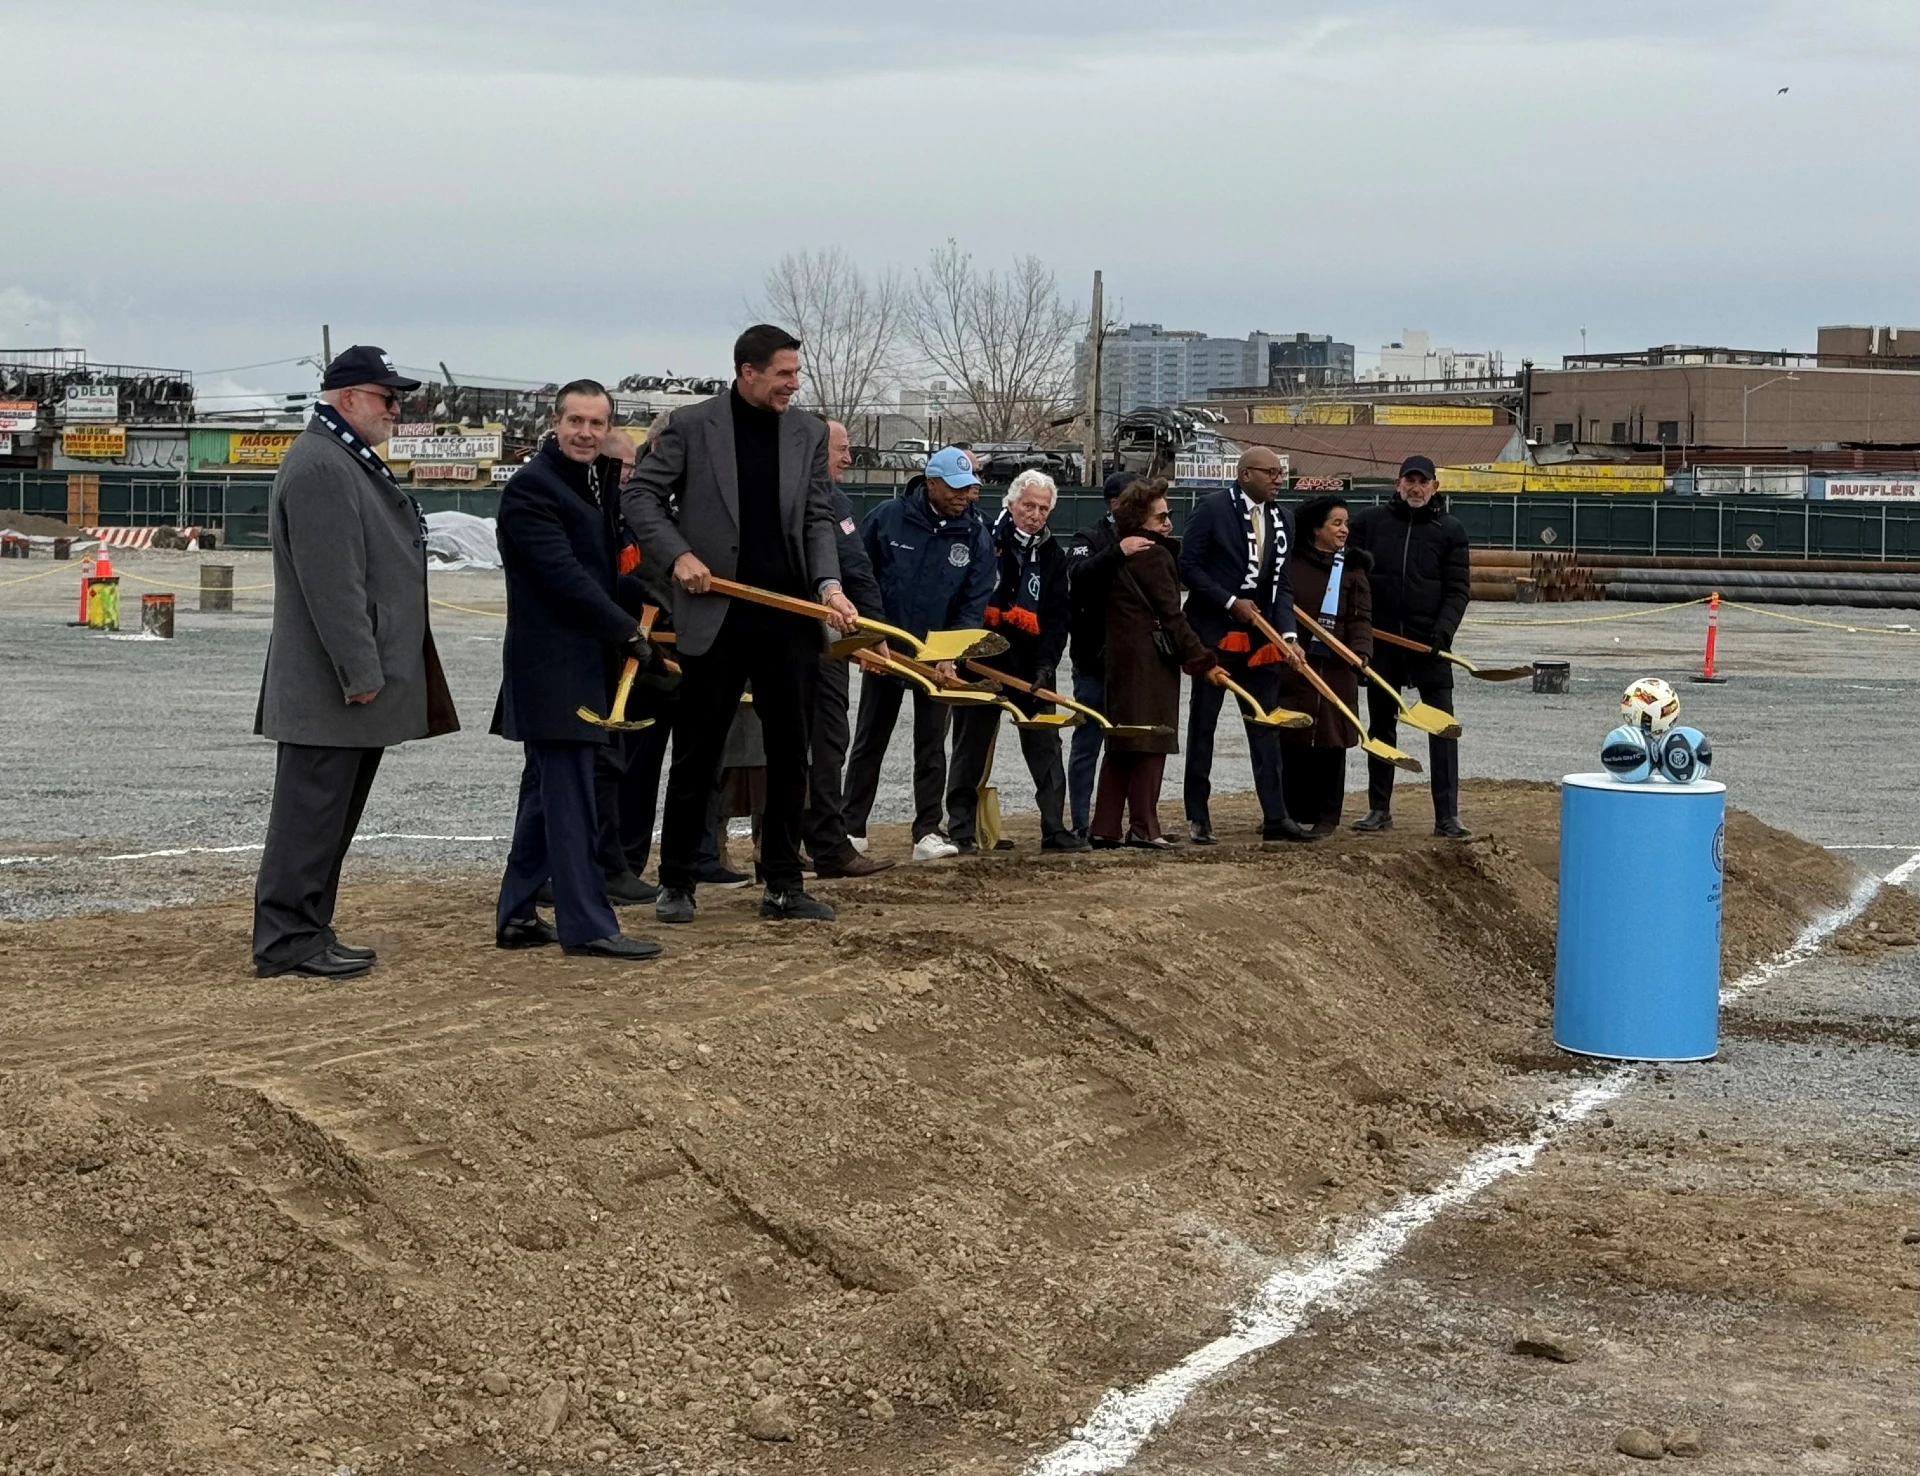
Groundbreaking for New York City FC’s stadium. Photo: Wikimedia Commons (CC BY 4.0; see source page for author attribution).

The remaining 107 stadiums and arenas received subsidies lower than the average value of the team to the community, but it is worth noting some important caveats to this. In all these cases, the answer is simply that the subsidy was possibly worthwhile, not that it was worthwhile. It’s an important distinction because it’s often impossible to know if a team would leave if a new venue was built or not. The evaluation provided shows that in the event a team is certain to leave, it is often worthwhile to subsidize a new stadium or arena to keep the team in town. It does not show that if a team simply asks for a new venue that it is always worth building, particularly if the market is large enough to be able to call out a bluff on relocation.
The study on the Minnesota Vikings spoke to this – They found a significant drop in support for a stadium depending on the probability of the team leaving. If the Vikings were certain to stay, support for a new stadium was simply not there. Based on both the Pittsburgh and Spanish study, the vast majority of benefit associate with a team is “nonuse” benefit, meaning only a small percentage relates to actually attending games. It’s that subset that can potentially benefit from a new stadium from the improved amenities and comfort, but it would be extremely difficult for this to be enough to justify a new stadium for a team that is remaining in the city.
It’s worth noting that while many modern venues can potentially justify their public subsidy in order to keep the team, the escalating costs of stadium construction might change this equation sooner rather than later. Several stadiums are now under construction with costs in the billions. The Jaguars new stadium is receiving $775 million in public funding. The Browns new stadium is costing taxpayers $845 million. The Thunder have $850 million in public funds going towards their new arena, and next year the Tennessee Titans will be moving into the new Nissan Stadium with the public covering a record $1.26 billion in costs. These decisions are no longer clear even if the team were to leave with each one of these venues only being justified if both the team were to leave the region and a high enough number within the ranges of potential utility per person were selected. These decisions should absolutely have more rigor and analysis applied to them before committing almost a billion dollars.
Despite the utility gained by keeping a team in the city, many will often balk at the idea, noting that the owners are rich enough to build it themselves, so why should the public subsidize the construction? It’s an understandable reaction and from a standpoint of fairness can’t be easily refuted. That reaction however relies upon the premise that the funding decision is a zero-sum game. Either the owner wins or the public wins. In reality, it’s possible both can win. If a new stadium keeps a team in the city, and the social welfare of having the team exceeds the cost of the stadium, letting the team leave simply out of a frustration that the owner can afford the stadium does nothing but leave the city worse off. The total social welfare in the region declines, and the owner simply moves the team to a location that will provide a new stadium, and because of the collective utility of having a team, there’s always a lengthy list of eager regions.
Stadiums are unlikely to return a positive financial investment to the community, and it is absolutely unfair for an owner to ask the public to subsidize their already profitable business. But as long as owners can use relocation as a threat to take away a beloved part of a community, stadium subsidies will continue to exist, and despite understandable frustrations, are in many cases the best thing for the region.
Supporting analysis
Methodology
I attempted to normalize for the sport by comparing popularity between the leagues. Conveniently, the NFL in the United States, La Liga in Spain, and the NPB in Japan all have a similar level of relative interest. In each country, roughly 43-46% of people follow and/or regularly watch games for the sport. The NHL is much lower at 17%. Pittsburgh is however known to be one of the most NHL-friendly cities in the United States. Because it wouldn’t be fair to compare one of 82 regular season NHL games with one of 17 NFL games in terms of ratings, the best comparison available is ratings in a possible elimination playoff game for the Penguins (NHL) and Steelers (NFL). Penguins elimination games typically get a Neilsen rating of between 12 and 15, while Steelers games get Neilson ratings for elimination games of 36 to 45. The ratings (3x) seem to align roughly with the general interest levels (2.5x), so we can use this as a range to factor up the Penguins number to a theoretical Steelers number.
Currencies were first inflated to 2026 using inflation within the country of that currency before converting to USD. Households were converted to total adults using a number of 1.85 which was found to be similar in both Pittsburgh and Minneapolis regions. Finally, to convert from lifecycle to an annual figure a stadium life of 30 years was assumed, alongside an economic real discount rate of 3.5%.
Key sources
- https://sabr.org/bioproj/person/john-i-taylor/
- https://www.andrewclem.com/Baseball/Stadium_chronology.html
- https://e.infogram.com/f29c8a12-2e5a-4909-969e-60499d2f5748?src=embed
- https://www.spglobal.com/market-intelligence/en/news-insights/research/state-of-us-sports-viewing-2025
- https://www.espn.com/nfl/story/_/id/14554759/nfl-los-angeles-brief-history-relocation-threats-rumors-leverage
- https://www.spglobal.com/market-intelligence/en/news-insights/research/2026/07/us-sports-viewing-casual-to-avid-sports-fans
- https://journals.sagepub.com/doi/10.1177/152700250100200102
- https://www.researchgate.net/publication/46568544_Estimating_Local_Welfare_Generated_by_an_NFL_Team_under_Credible_Threat_of_Relocation
- https://journals.sagepub.com/doi/abs/10.1177/1527002510385301
- https://www.researchgate.net/publication/291382216_The_Economic_Value_of_Having_a_Professional_Sports_Team_in_a_City